Built around your workflow, not a template.
Dashboards, automation, and reporting systems designed specifically for your organization — from a single tool to a full data pipeline.
Solutions shaped around your problem
Custom dashboards
Live, interactive dashboards connected directly to your existing data sources.
Workflow automation
Remove manual, repetitive data work by automating collection, cleaning, and distribution.
Automated reporting
Recurring reports generated and delivered on a schedule, with zero manual assembly.
System integrations
Connect tools that don’t talk to each other today — CRM, spreadsheets, databases, and more.
AI-assisted tools
Purpose-built internal tools using AI to summarize, classify, or flag things your team cares about.
Full data pipelines
End-to-end systems moving data from raw source to finished, decision-ready output.
From conversation to delivered system
Discovery call
A free 30-minute call to understand your workflow, tools, and the outcome you’re after.
Scope & proposal
You receive a fixed-scope proposal with timeline and cost — no surprises once work begins.
Build
We build in stages with check-ins along the way, so you’re never waiting in the dark.
Deliver & support
You receive the finished system, documentation, training, and a support window after launch.
Example projects
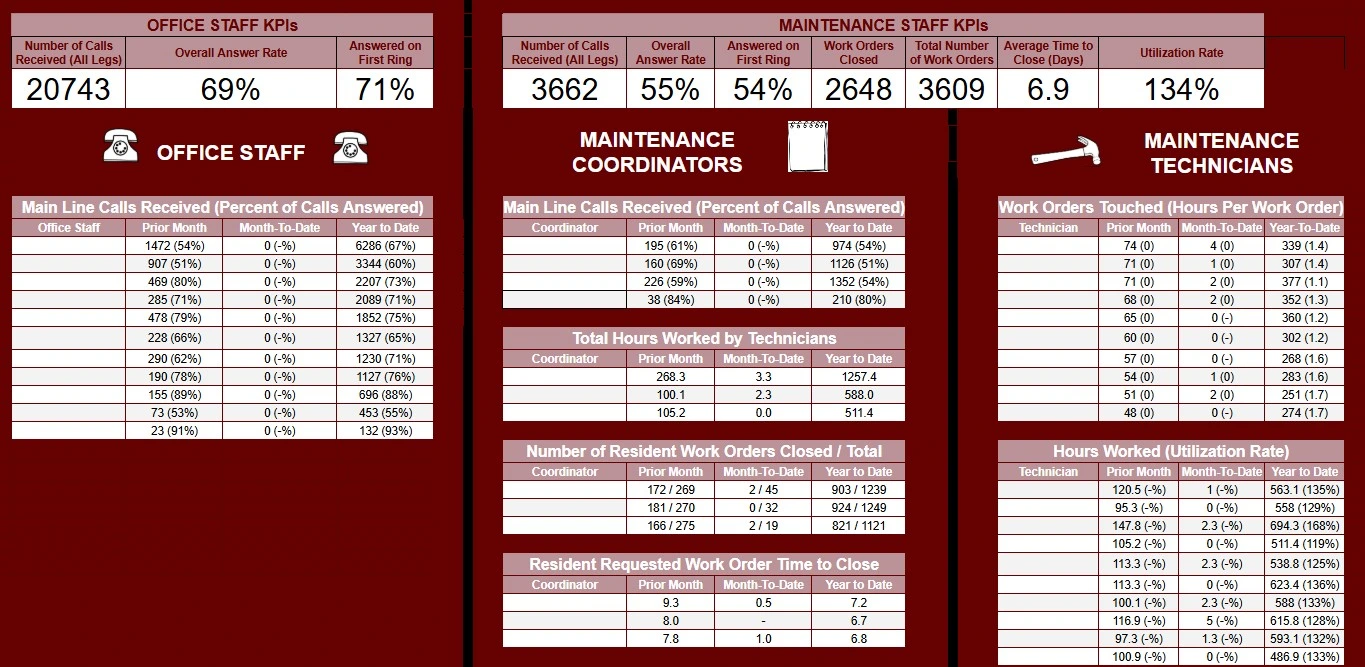
Property Management Office & Maintenance Dashboard
A live dashboard tracking office staff call-answer performance, maintenance coordinator workload, and technician utilization across a property portfolio — giving management clear visibility into call responsiveness and maintenance throughput without manually pulling reports from separate systems.
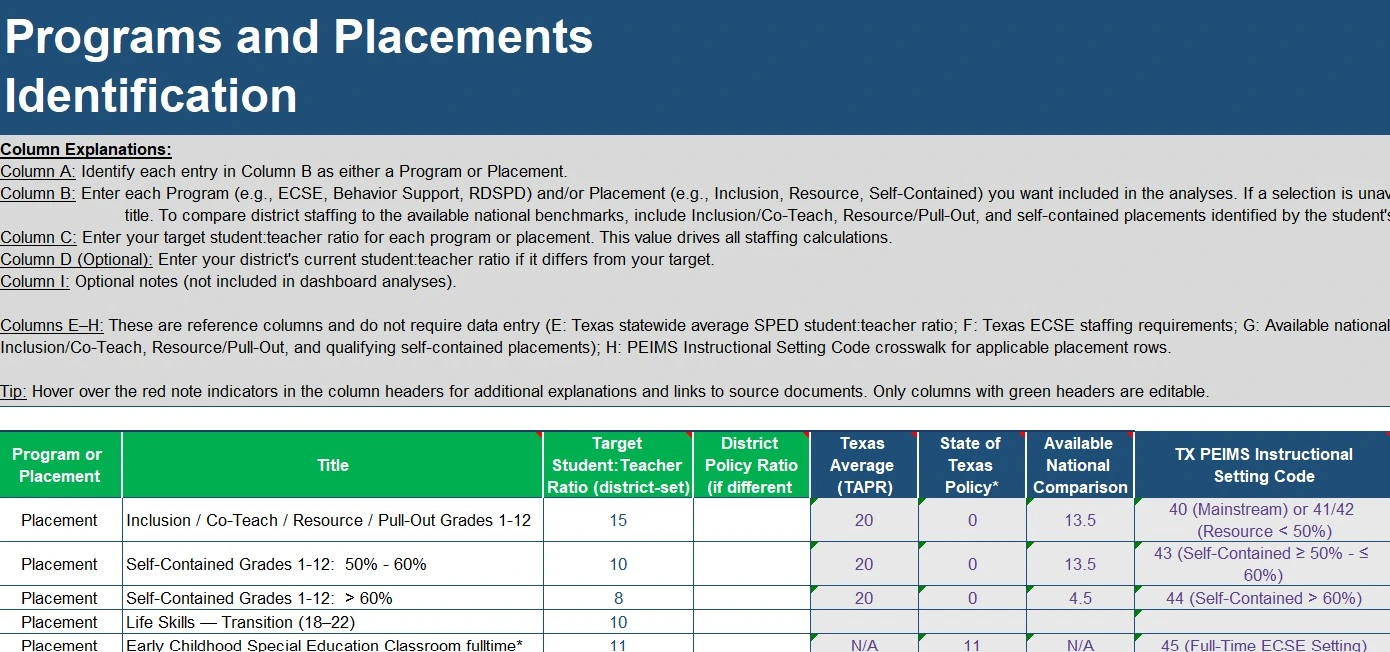
Special Education Staffing & Placement Ratio Tool
A structured planning tool that lets a district set target student:teacher ratios by program and placement type (Inclusion, Resource, Self-Contained, Life Skills, and more), comparing them against Texas state averages and available national benchmarks, with built-in PEIMS instructional setting code mapping.
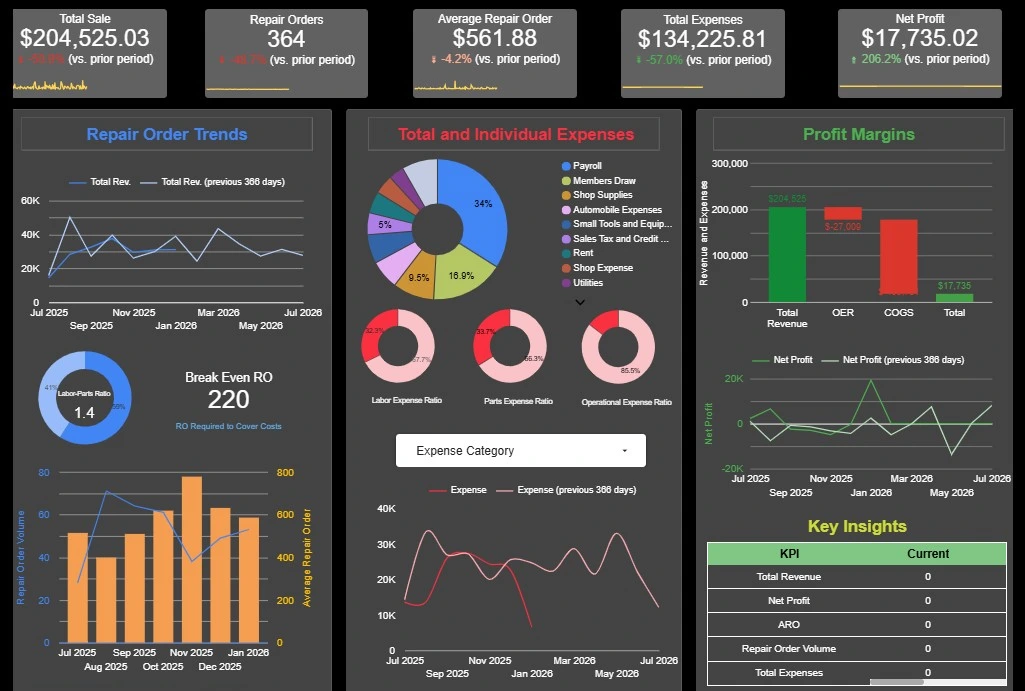
Auto Shop Financial Diagnostic Dashboard
Consolidates repair order volume, average repair order value, labor/parts/operational expense ratios, and break-even repair-order thresholds into a single live view — so shop owners can track profitability trends without reconciling multiple spreadsheets.
What projects typically cost
Every project is scoped individually — these ranges are a starting reference, not a quote.
Single Tool
One dashboard, automation, or integration solving a specific, well-defined problem.
Multi-Part System
Several connected tools — e.g., a dashboard plus the automation feeding it.
Full Pipeline
End-to-end systems spanning multiple data sources, tools, and stakeholders.
Tell us about your project
The more context you give us, the more useful our first call will be. Helpful things to mention:
- What tools or spreadsheets you’re currently using
- What’s manual today that you wish wasn’t
- Who needs to see the end result, and how often
- Any deadline or budget range you’re working with